Source
from IPython.display import IFrame
import pandas as pd
import sage_data_client
import holoviews as hv
import hvplot.pandas
from metpy.units import units
import metpy.calc as mpcalc
from bokeh.models import DatetimeTickFormatter
import sage_data_client

hv.extension("bokeh")

def apply_formatter(plot, element):
    plot.handles['xaxis'].formatter = DatetimeTickFormatter(hours='%m/%d/%Y \n %l:%M %p',
                                                            minutes='%m/%d/%Y \n %l:%M %p',
                                                            hourmin='%m/%d/%Y \n %l:%M %p',
                                                            days='%m/%d/%Y \n %l:%M %p',
                                                            months='%m/%d/%Y \n %l:%M %p')

def add_local_time(df):
    df["Local_Time"] = pd.to_datetime(df.index,unit='s', utc=True)\
                          .map(lambda x: x.tz_convert('America/Chicago'))
    return df
import warnings
warnings.filterwarnings('ignore')
Loading...
Temperature and Dewpoint
Source
wxt_df = sage_data_client.query(
    start="-12h",
    filter={
        "vsn": "W08B",
        "name": "wxt.env.temp|wxt.env.humidity"
    }
).set_index("timestamp")

temp_df = wxt_df.loc[wxt_df.name == "wxt.env.temp"]
hum_df = wxt_df.loc[wxt_df.name == "wxt.env.humidity"]

min_df = temp_df[["value"]].resample("1min").mean()
min_df["rh"] = hum_df[["value"]].resample("1min").mean()

min_df["tmpf"] = (min_df.value.values * units.degC).to("degF").m
min_df["dwpf"] = mpcalc.dewpoint_from_relative_humidity(min_df.tmpf.values * units.degF,
                                       min_df.rh.values * units.percent).to("degF").m

min_df = add_local_time(min_df)

temp_plot = min_df.hvplot(x='Local_Time',
                          y='tmpf',
                          color = "r",
                          label="Temperature [degF]"
                         )
dewp_plot = min_df.hvplot(x='Local_Time',
                          y='dwpf',
                          color="g",
                          title="Current Weather at NEIU Carruthers Center (CCICS)",
                          label="Dewpoint [degF]",
                          ylabel="Temperature | Dewpoint \n [degF]",
                          xlabel="Local Time (Central/US)")

(temp_plot * dewp_plot).opts(hooks=[apply_formatter], legend_position='right')
Loading...
Air Quality
Source
df = sage_data_client.query(
    start="-12h",
    filter={
        "vsn": "W08B",
        "name": "aqt.particle.pm2.5"
    }
).set_index("timestamp")

df = add_local_time(df)[["value", "Local_Time"]].resample("5min").mean()

df.hvplot(label='PM 2.5 Values at NEIU Carruthers Center (CCICS)',
          x='Local_Time',
          y='value',
          ylabel='PM 2.5 \n [microgram per cubic meter]',
          xlabel="Local Time (Central/US)").opts(hooks=[apply_formatter])
Loading...
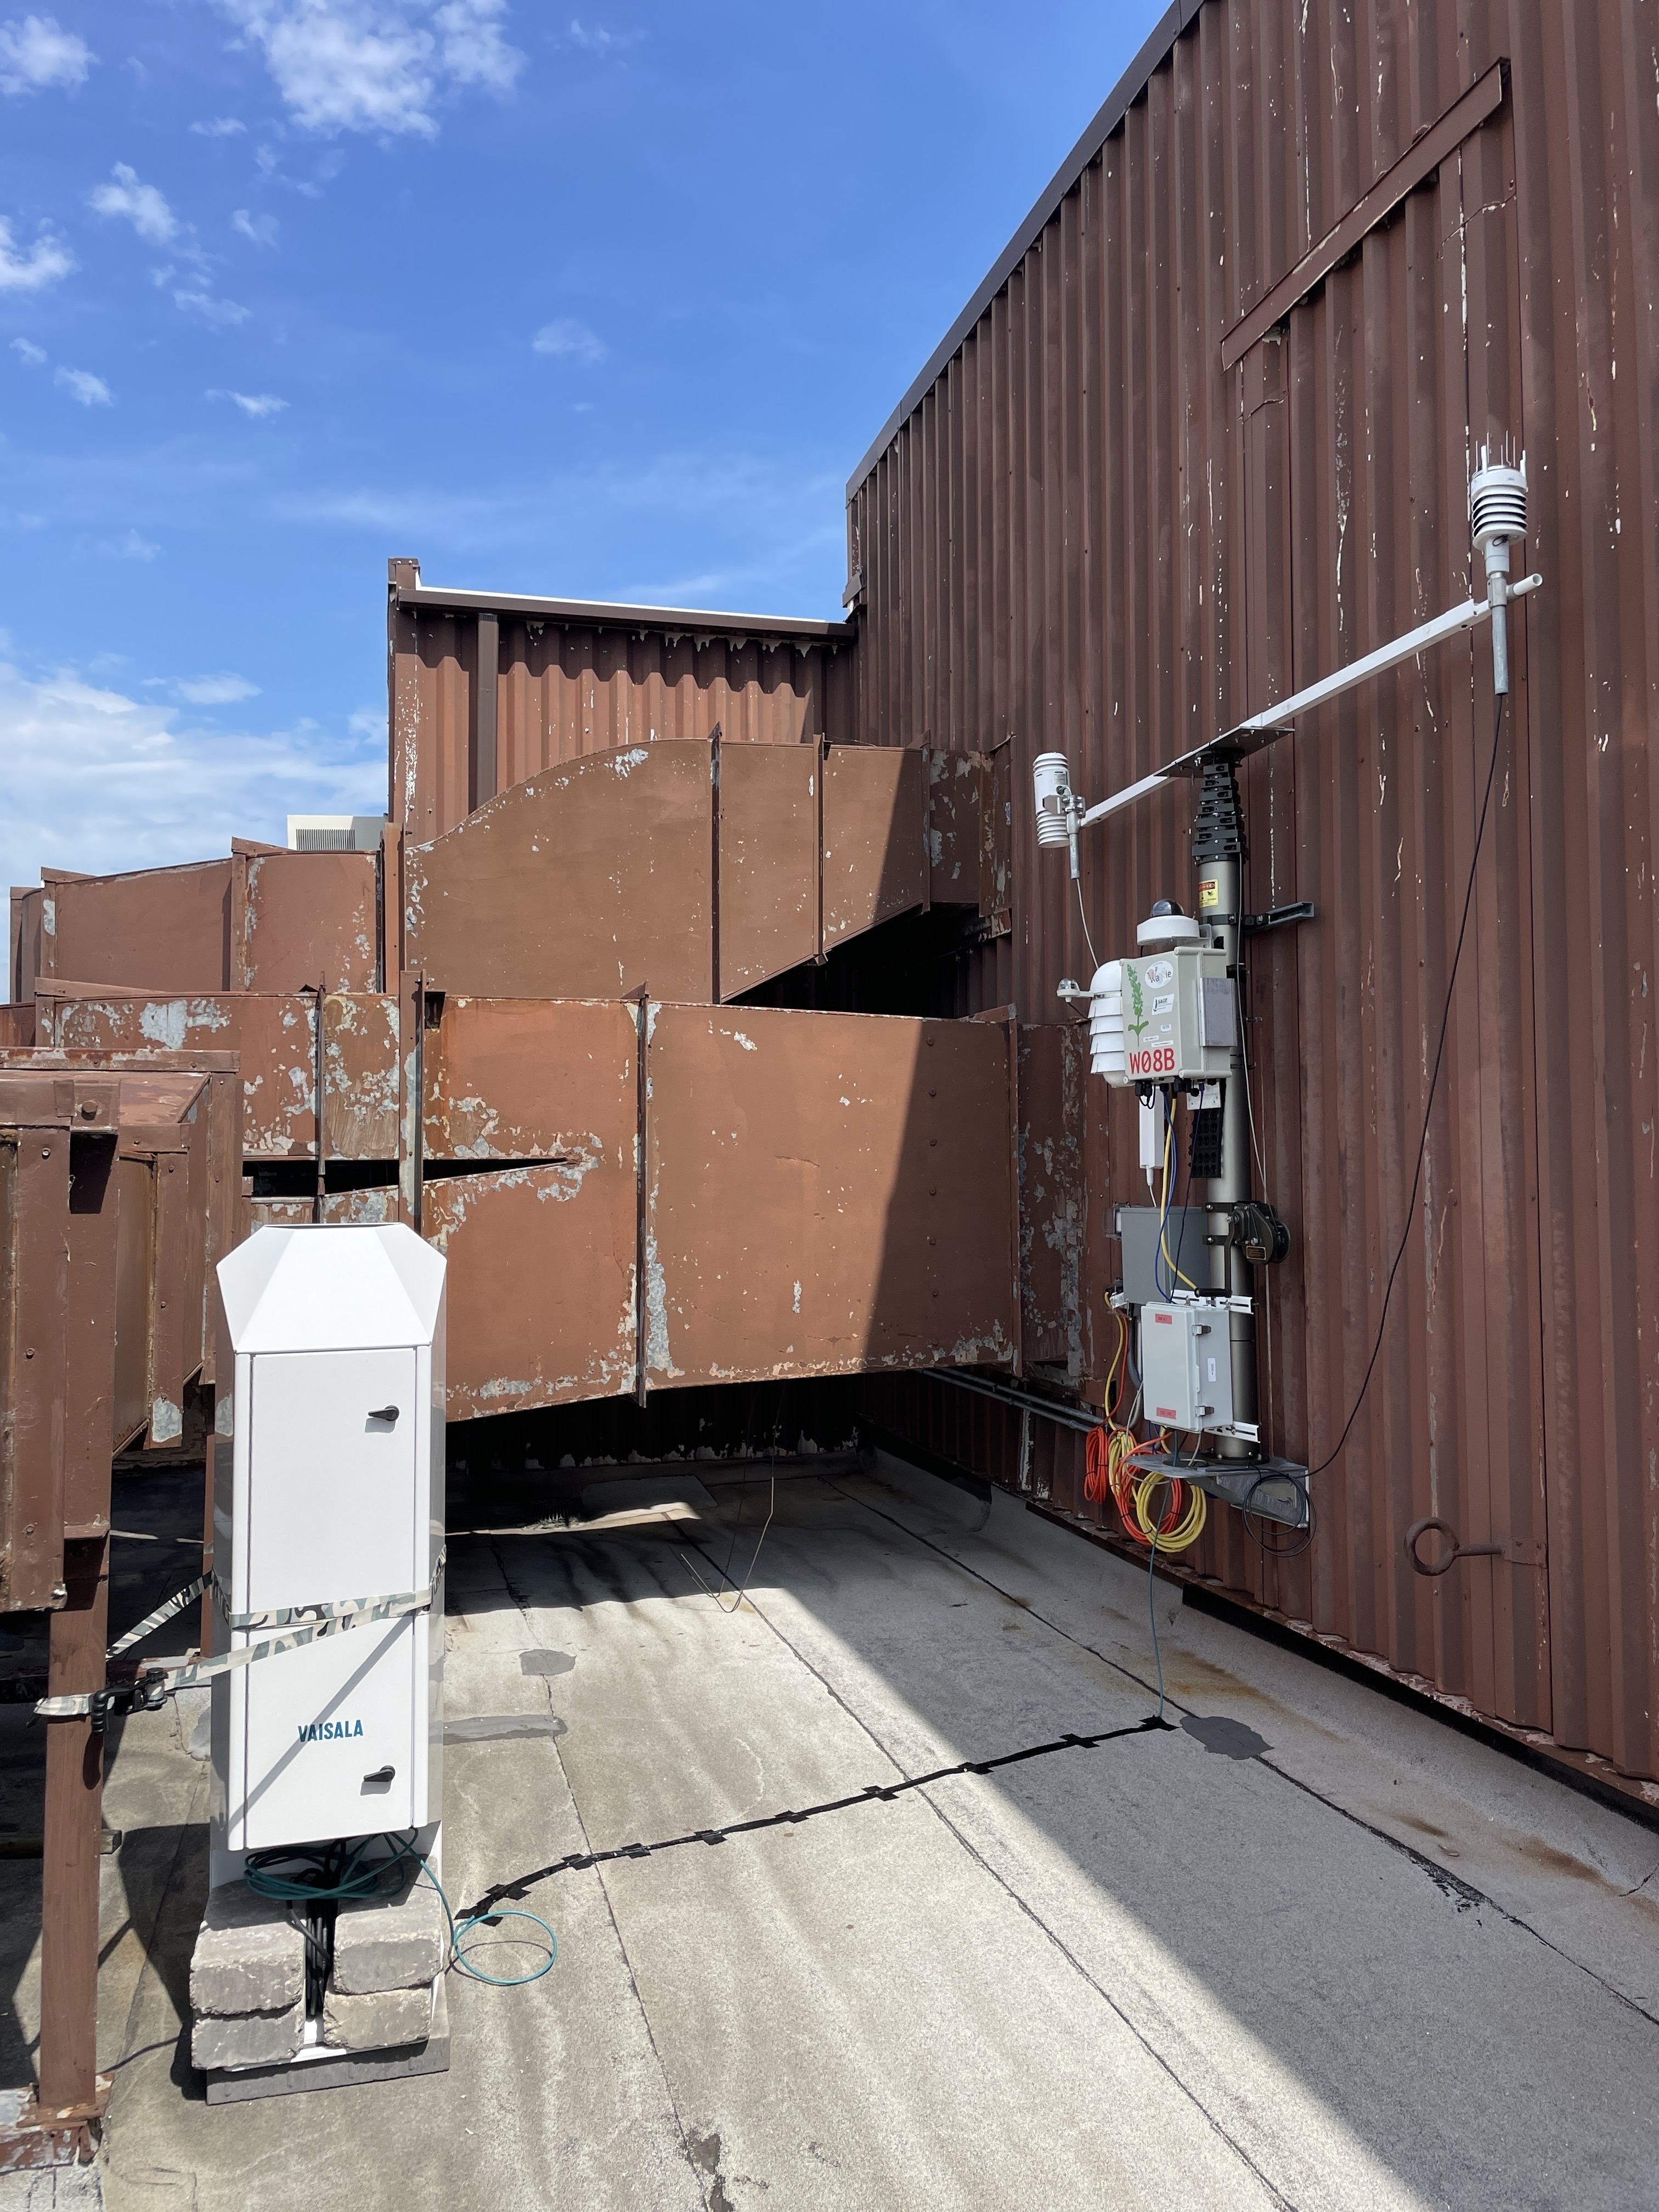
Location
Observations from the NEIU Carruthers Center, on the rooftop of the Jacob H. Carruthers Center for Inner City Studies (CCICS) tower.
Source
IFrame("https://www.google.com/maps/embed?pb=!1m17!1m12!1m3!1d2965.505781491773!2d-87.61214158836579!3d41.822942471127895!2m3!1f0!2f0!3f0!3m2!1i1024!2i768!4f13.1!3m2!1m1!2zNDHCsDQ5JzIyLjYiTiA4N8KwMzYnMzQuNCJX!5e1!3m2!1sen!2sus!4v1745337439017!5m2!1sen!2sus", width=700, height=350)Loading...