Read Data from the Doppler Lidar#
import glob
import utils
import xarray as xr
import pandas as pd
from datetime import datetime, timedelta
from datetime import datetime
import hvplot.xarray
import holoviews as hv
Compile a list of data files#
files = sorted(glob.glob('../../data/scanning-doppler-lidar/*'))
Create helper functions to read in the data#
def convert_to_hours_minutes_seconds(decimal_hour, initial_time):
    delta = timedelta(hours=decimal_hour)
    return datetime(initial_time.year, initial_time.month, initial_time.day) + delta

def read_as_netcdf(file):
    field_dict = utils.hpl2dict(file)
    initial_time = pd.to_datetime(field_dict['start_time'])

    time = pd.to_datetime([convert_to_hours_minutes_seconds(x, initial_time) for x in field_dict['decimal_time']])

    ds = xr.Dataset(coords={'range':field_dict['center_of_gates'],
                            'time': time,
                            'azimuth': ('time', field_dict['azimuth'])},
                    data_vars={'radial_velocity':(['range', 'time'],
                                                  field_dict['radial_velocity']),
                               'beta': (('range', 'time'),
                                        field_dict['beta']),
                               'intensity': (('range', 'time'),
                                             field_dict['intensity'])
                              }
                   )
    return ds
Read in the datasets and merge into a single dataset#
datasets = [read_as_netcdf(file) for file in files]
datasets
[<xarray.Dataset> Size: 43kB
 Dimensions:          (range: 133, time: 13)
 Coordinates:
   * range            (range) float64 1kB 12.0 36.0 60.0 ... 3.156e+03 3.18e+03
   * time             (time) datetime64[ns] 104B 2022-12-08T15:05:47.699988 .....
     azimuth          (time) float64 104B 0.01 360.0 0.0 0.0 ... 0.0 0.0 0.0 0.0
 Data variables:
     radial_velocity  (range, time) float64 14kB 0.4969 0.2675 ... 0.3058 -13.49
     beta             (range, time) float64 14kB 7.989e-06 ... -7.794e-07
     intensity        (range, time) float64 14kB 1.142 1.493 ... 1.517 0.9974,
 <xarray.Dataset> Size: 43kB
 Dimensions:          (range: 133, time: 13)
 Coordinates:
   * range            (range) float64 1kB 12.0 36.0 60.0 ... 3.156e+03 3.18e+03
   * time             (time) datetime64[ns] 104B 2022-12-08T15:15:48.200004 .....
     azimuth          (time) float64 104B 0.01 360.0 0.0 0.0 ... 0.0 0.0 0.0 0.0
 Data variables:
     radial_velocity  (range, time) float64 14kB 0.4586 0.4586 ... 6.039 1.796
     beta             (range, time) float64 14kB 1.506e-05 ... -5.417e-07
     intensity        (range, time) float64 14kB 1.267 1.088 ... 1.007 0.9982,
 <xarray.Dataset> Size: 43kB
 Dimensions:          (range: 133, time: 13)
 Coordinates:
   * range            (range) float64 1kB 12.0 36.0 60.0 ... 3.156e+03 3.18e+03
   * time             (time) datetime64[ns] 104B 2022-12-08T15:25:48.500004 .....
     azimuth          (time) float64 104B 0.01 360.0 0.0 0.0 ... 0.0 0.0 0.0 0.0
 Data variables:
     radial_velocity  (range, time) float64 14kB 0.344 0.2293 ... -17.85 18.27
     beta             (range, time) float64 14kB 1.551e-06 ... 6.803e-07
     intensity        (range, time) float64 14kB 1.028 1.745 1.253 ... 1.0 1.002,
 <xarray.Dataset> Size: 43kB
 Dimensions:          (range: 133, time: 13)
 Coordinates:
   * range            (range) float64 1kB 12.0 36.0 60.0 ... 3.156e+03 3.18e+03
   * time             (time) datetime64[ns] 104B 2022-12-08T15:35:48.639984 .....
     azimuth          (time) float64 104B 0.01 0.0 360.0 0.0 ... 0.0 0.0 0.0 0.0
 Data variables:
     radial_velocity  (range, time) float64 14kB 0.5351 0.4204 ... 6.345 11.66
     beta             (range, time) float64 14kB -7.093e-06 ... 7.924e-07
     intensity        (range, time) float64 14kB 0.874 1.136 ... 1.006 1.003,
 <xarray.Dataset> Size: 43kB
 Dimensions:          (range: 133, time: 13)
 Coordinates:
   * range            (range) float64 1kB 12.0 36.0 60.0 ... 3.156e+03 3.18e+03
   * time             (time) datetime64[ns] 104B 2022-12-08T15:45:48.719988 .....
     azimuth          (time) float64 104B 0.01 360.0 0.0 0.0 ... 0.0 0.0 360.0
 Data variables:
     radial_velocity  (range, time) float64 14kB 0.1529 0.344 ... -9.976 -0.2675
     beta             (range, time) float64 14kB -1.566e-05 ... 2.063e-06
     intensity        (range, time) float64 14kB 0.7219 0.8726 ... 1.007 1.007,
 <xarray.Dataset> Size: 43kB
 Dimensions:          (range: 133, time: 13)
 Coordinates:
   * range            (range) float64 1kB 12.0 36.0 60.0 ... 3.156e+03 3.18e+03
   * time             (time) datetime64[ns] 104B 2022-12-08T15:55:49.149984 .....
     azimuth          (time) float64 104B 0.01 360.0 0.0 0.0 ... 0.0 0.0 0.0 0.0
 Data variables:
     radial_velocity  (range, time) float64 14kB 0.344 0.3058 ... -1.873 -17.66
     beta             (range, time) float64 14kB 9.181e-06 ... 3.945e-07
     intensity        (range, time) float64 14kB 1.163 1.077 ... 1.008 1.001,
 <xarray.Dataset> Size: 43kB
 Dimensions:          (range: 133, time: 13)
 Coordinates:
   * range            (range) float64 1kB 12.0 36.0 60.0 ... 3.156e+03 3.18e+03
   * time             (time) datetime64[ns] 104B 2022-12-08T16:05:49.509996 .....
     azimuth          (time) float64 104B 0.01 360.0 0.0 0.0 ... 0.0 0.0 0.0 0.0
 Data variables:
     radial_velocity  (range, time) float64 14kB 0.1911 0.4204 ... 12.5 -13.42
     beta             (range, time) float64 14kB -3.186e-06 ... -2.121e-06
     intensity        (range, time) float64 14kB 0.9434 0.6776 ... 1.007 0.993,
 <xarray.Dataset> Size: 43kB
 Dimensions:          (range: 133, time: 13)
 Coordinates:
   * range            (range) float64 1kB 12.0 36.0 60.0 ... 3.156e+03 3.18e+03
   * time             (time) datetime64[ns] 104B 2022-12-08T16:15:49.860000 .....
     azimuth          (time) float64 104B 0.01 360.0 0.0 0.0 ... 0.0 0.0 0.0 0.0
 Data variables:
     radial_velocity  (range, time) float64 14kB 0.3822 0.5351 ... 8.103 -12.69
     beta             (range, time) float64 14kB -1.784e-05 ... 1.075e-06
     intensity        (range, time) float64 14kB 0.6832 0.6628 ... 1.008 1.004,
 <xarray.Dataset> Size: 43kB
 Dimensions:          (range: 133, time: 13)
 Coordinates:
   * range            (range) float64 1kB 12.0 36.0 60.0 ... 3.156e+03 3.18e+03
   * time             (time) datetime64[ns] 104B 2022-12-08T16:25:50.009988 .....
     azimuth          (time) float64 104B 0.01 360.0 0.0 0.0 ... 0.0 0.0 0.0 0.0
 Data variables:
     radial_velocity  (range, time) float64 14kB 12.0 0.1911 ... -6.65 -7.453
     beta             (range, time) float64 14kB -4.071e-05 ... 4.399e-07
     intensity        (range, time) float64 14kB 0.2771 0.9386 ... 1.0 1.001,
 <xarray.Dataset> Size: 43kB
 Dimensions:          (range: 133, time: 13)
 Coordinates:
   * range            (range) float64 1kB 12.0 36.0 60.0 ... 3.156e+03 3.18e+03
   * time             (time) datetime64[ns] 104B 2022-12-08T16:35:50.179992 .....
     azimuth          (time) float64 104B 0.01 360.0 0.0 0.0 ... 0.0 0.0 0.0 0.0
 Data variables:
     radial_velocity  (range, time) float64 14kB 0.2293 0.4586 ... -19.0 17.77
     beta             (range, time) float64 14kB -1.748e-05 ... 1.562e-06
     intensity        (range, time) float64 14kB 0.6896 0.78 ... 0.9996 1.005]
ds = xr.concat(datasets, dim='time')
(ds.radial_velocity.hvplot(clim=(-5, 5), cmap='seismic') + ds.intensity.hvplot(cmap='magma', clim=(0, 4))).cols(1)
WARNING:param.Image00267: Image dimension time is not evenly sampled to relative tolerance of 0.001. Please use the QuadMesh element for irregularly sampled data or set a higher tolerance on hv.config.image_rtol or the rtol parameter in the Image constructor.
WARNING:param.Image00267: Image dimension time is not evenly sampled to relative tolerance of 0.001. Please use the QuadMesh element for irregularly sampled data or set a higher tolerance on hv.config.image_rtol or the rtol parameter in the Image constructor.
WARNING:param.Image00302: Image dimension time is not evenly sampled to relative tolerance of 0.001. Please use the QuadMesh element for irregularly sampled data or set a higher tolerance on hv.config.image_rtol or the rtol parameter in the Image constructor.
WARNING:param.Image00302: Image dimension time is not evenly sampled to relative tolerance of 0.001. Please use the QuadMesh element for irregularly sampled data or set a higher tolerance on hv.config.image_rtol or the rtol parameter in the Image constructor.
ds.beta.max()
<xarray.DataArray 'beta' ()> Size: 8B
array(0.00075305)
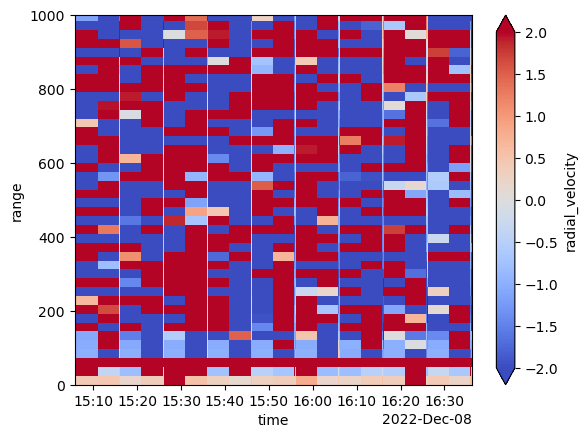
ds.radial_velocity.plot(ylim=(0, 1000), vmin=-2, vmax=2, cmap='coolwarm')
<matplotlib.collections.QuadMesh at 0x7f2a0c8337f0>
def convert_to_hours_minutes_seconds(decimal_hour, initial_time=initial_time):
    delta = timedelta(hours=decimal_hour)
    return datetime(initial_time.year, initial_time.month, initial_time.day) + delta
---------------------------------------------------------------------------
NameError                                 Traceback (most recent call last)
Cell In[10], line 1
----> 1 def convert_to_hours_minutes_seconds(decimal_hour, initial_time=initial_time):
      2     delta = timedelta(hours=decimal_hour)
      3     return datetime(initial_time.year, initial_time.month, initial_time.day) + delta

NameError: name 'initial_time' is not defined
from datetime import timedelta
initial_time + timedelta(hours=72.345)
Timestamp('2022-12-11 15:26:30.230000')
pd.to_datetime("%d:%02d.%02.6f" % (hours, minutes, seconds))
---------------------------------------------------------------------------
NameError                                 Traceback (most recent call last)
Cell In[170], line 1
----> 1 pd.to_datetime("%d:%02d.%02.6f" % (hours, minutes, seconds))

NameError: name 'hours' is not defined
"%02.6f" % 7.329996000000392
'7.329996'
pd.to_datetime(['2022-12-08 15:05.47'])
DatetimeIndex(['2022-12-08 15:05:28'], dtype='datetime64[ns]', freq=None)
time
DatetimeIndex(['2022-12-08 15:05:47.699988', '2022-12-08 15:05:49.340004',
               '2022-12-08 15:05:50.970012', '2022-12-08 15:05:52.609992',
               '2022-12-08 15:05:54.250008', '2022-12-08 15:05:55.880016',
               '2022-12-08 15:05:57.519996', '2022-12-08 15:05:59.150004',
               '2022-12-08 15:06:00.780012', '2022-12-08 15:06:02.419992',
               '2022-12-08 15:06:04.060008', '2022-12-08 15:06:05.690016',
               '2022-12-08 15:06:07.329996'],
              dtype='datetime64[ns]', freq=None)
field_dict['spectral_width'].shape
(133, 13)
field_dict['center_of_gates'].shape
(133,)
field_dict
{'filename': 'RHI_240_20221208_150544.hpl',
 'system_id': 240,
 'number_of_gates': 133,
 'range_gate_length_m': 24.0,
 'gate_length_pts': 8,
 'pulses_per_ray': 5000,
 'number_of_waypoints_in_file': 13,
 'no_of_rays_in_file': 13,
 'scan_type': 'RHI',
 'focus_range': '65535',
 'start_time': '20221208 15:05:48.23',
 'resolution': '0.0382 m s-1',
 'range_gates': array([  0,   1,   2,   3,   4,   5,   6,   7,   8,   9,  10,  11,  12,
         13,  14,  15,  16,  17,  18,  19,  20,  21,  22,  23,  24,  25,
         26,  27,  28,  29,  30,  31,  32,  33,  34,  35,  36,  37,  38,
         39,  40,  41,  42,  43,  44,  45,  46,  47,  48,  49,  50,  51,
         52,  53,  54,  55,  56,  57,  58,  59,  60,  61,  62,  63,  64,
         65,  66,  67,  68,  69,  70,  71,  72,  73,  74,  75,  76,  77,
         78,  79,  80,  81,  82,  83,  84,  85,  86,  87,  88,  89,  90,
         91,  92,  93,  94,  95,  96,  97,  98,  99, 100, 101, 102, 103,
        104, 105, 106, 107, 108, 109, 110, 111, 112, 113, 114, 115, 116,
        117, 118, 119, 120, 121, 122, 123, 124, 125, 126, 127, 128, 129,
        130, 131, 132]),
 'center_of_gates': array([  12.,   36.,   60.,   84.,  108.,  132.,  156.,  180.,  204.,
         228.,  252.,  276.,  300.,  324.,  348.,  372.,  396.,  420.,
         444.,  468.,  492.,  516.,  540.,  564.,  588.,  612.,  636.,
         660.,  684.,  708.,  732.,  756.,  780.,  804.,  828.,  852.,
         876.,  900.,  924.,  948.,  972.,  996., 1020., 1044., 1068.,
        1092., 1116., 1140., 1164., 1188., 1212., 1236., 1260., 1284.,
        1308., 1332., 1356., 1380., 1404., 1428., 1452., 1476., 1500.,
        1524., 1548., 1572., 1596., 1620., 1644., 1668., 1692., 1716.,
        1740., 1764., 1788., 1812., 1836., 1860., 1884., 1908., 1932.,
        1956., 1980., 2004., 2028., 2052., 2076., 2100., 2124., 2148.,
        2172., 2196., 2220., 2244., 2268., 2292., 2316., 2340., 2364.,
        2388., 2412., 2436., 2460., 2484., 2508., 2532., 2556., 2580.,
        2604., 2628., 2652., 2676., 2700., 2724., 2748., 2772., 2796.,
        2820., 2844., 2868., 2892., 2916., 2940., 2964., 2988., 3012.,
        3036., 3060., 3084., 3108., 3132., 3156., 3180.]),
 'radial_velocity': array([[  0.4969,   0.2675,   0.344 , ...,   0.5351,   0.4204,   0.4204],
        [ -0.344 ,  -0.688 ,  -0.5733, ...,  11.7337,  11.7719,  11.963 ],
        [ 11.619 ,  11.6955,  11.8483, ...,  11.8101,  11.8483,  12.0394],
        ...,
        [ -1.9875, -16.5877,  -3.7074, ..., -14.7913,   0.2675, -15.4028],
        [  7.7205,  -3.2487,   9.5551, ...,  -2.943 ,  -0.1147, -12.8038],
        [ 19.1867,   4.854 ,  18.6133, ..., -14.7913,   0.3058, -13.4918]]),
 'intensity': array([[1.141879, 1.49347 , 1.455399, ..., 0.844797, 0.954667, 1.001475],
        [1.105347, 1.463778, 1.39274 , ..., 0.849536, 0.942302, 0.979837],
        [1.021476, 1.082985, 1.061974, ..., 0.97966 , 0.985956, 1.004995],
        ...,
        [1.002233, 0.999644, 0.998573, ..., 1.010497, 3.379957, 0.999662],
        [0.99991 , 0.99865 , 0.988375, ..., 1.000328, 2.219137, 0.999468],
        [1.000787, 0.999883, 0.998965, ..., 0.997938, 1.517312, 0.997432]]),
 'beta': array([[ 7.989228e-06,  2.778736e-05,  2.564359e-05, ..., -8.739524e-06,
         -2.552723e-06,  8.307399e-08],
        [ 5.938080e-06,  2.614180e-05,  2.213759e-05, ..., -8.481209e-06,
         -3.252267e-06, -1.136548e-06],
        [ 1.212306e-06,  4.684448e-06,  3.498434e-06, ..., -1.148210e-06,
         -7.927657e-07,  2.819446e-07],
        ...,
        [ 6.606759e-07, -1.053746e-07, -4.222111e-07, ...,  3.105908e-06,
          7.041767e-04, -9.987265e-08],
        [-2.707911e-08, -4.045048e-07, -3.483673e-06, ...,  9.819745e-08,
          3.653321e-04, -1.592993e-07],
        [ 2.389713e-07, -3.556643e-08, -3.139982e-07, ..., -6.258545e-07,
          1.569954e-04, -7.794487e-07]]),
 'spectral_width': array([[nan, nan, nan, ..., nan, nan, nan],
        [nan, nan, nan, ..., nan, nan, nan],
        [nan, nan, nan, ..., nan, nan, nan],
        ...,
        [nan, nan, nan, ..., nan, nan, nan],
        [nan, nan, nan, ..., nan, nan, nan],
        [nan, nan, nan, ..., nan, nan, nan]]),
 'elevation': array([ -0.  ,  15.04,  30.03,  45.03,  60.03,  75.03,  90.03, 105.03,
        120.03, 135.03, 150.04, 165.03, 180.03]),
 'azimuth': array([1.0e-02, 3.6e+02, 0.0e+00, 0.0e+00, 0.0e+00, 0.0e+00, 0.0e+00,
        3.6e+02, 0.0e+00, 0.0e+00, 0.0e+00, 0.0e+00, 0.0e+00]),
 'decimal_time': array([15.09658333, 15.09703889, 15.09749167, 15.09794722, 15.09840278,
        15.09885556, 15.09931111, 15.09976389, 15.10021667, 15.10067222,
        15.10112778, 15.10158056, 15.10203611]),
 'pitch': array([0.45, 0.45, 0.45, 0.45, 0.34, 0.34, 0.34, 0.34, 0.34, 0.45, 0.45,
        0.34, 0.45]),
 'roll': array([-0.65, -0.65, -0.65, -0.65, -0.65, -0.65, -0.65, -0.65, -0.65,
        -0.65, -0.75, -0.65, -0.65])}
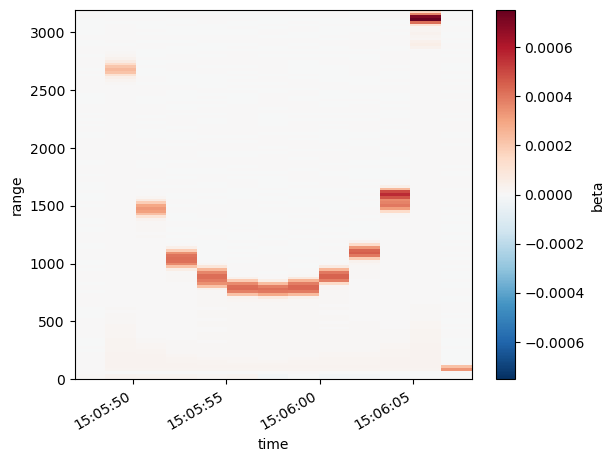
ds.beta.plot(x='time');
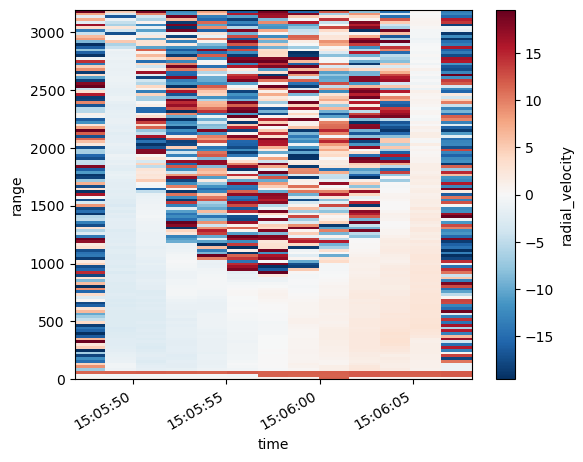
ds.radial_velocity.plot(x='time');
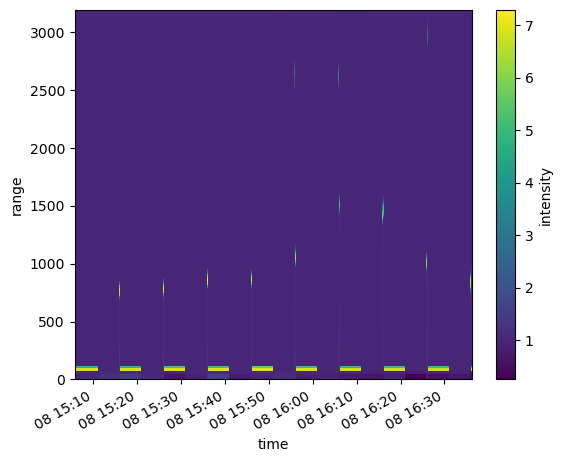
ds.intensity.plot()
<matplotlib.collections.QuadMesh at 0x151e8b8e0>
xr.Dataset(field_dict)
---------------------------------------------------------------------------
MissingDimensionsError                    Traceback (most recent call last)
Cell In[25], line 1
----> 1 xr.Dataset(field_dict)

File ~/miniforge3/envs/instrument-cookbooks-dev/lib/python3.9/site-packages/xarray/core/dataset.py:605, in Dataset.__init__(self, data_vars, coords, attrs)
    602 if isinstance(coords, Dataset):
    603     coords = coords.variables
--> 605 variables, coord_names, dims, indexes, _ = merge_data_and_coords(
    606     data_vars, coords, compat="broadcast_equals"
    607 )
    609 self._attrs = dict(attrs) if attrs is not None else None
    610 self._close = None

File ~/miniforge3/envs/instrument-cookbooks-dev/lib/python3.9/site-packages/xarray/core/merge.py:575, in merge_data_and_coords(data_vars, coords, compat, join)
    573 objects = [data_vars, coords]
    574 explicit_coords = coords.keys()
--> 575 return merge_core(
    576     objects,
    577     compat,
    578     join,
    579     explicit_coords=explicit_coords,
    580     indexes=Indexes(indexes, coords),
    581 )

File ~/miniforge3/envs/instrument-cookbooks-dev/lib/python3.9/site-packages/xarray/core/merge.py:755, in merge_core(objects, compat, join, combine_attrs, priority_arg, explicit_coords, indexes, fill_value)
    751 coerced = coerce_pandas_values(objects)
    752 aligned = deep_align(
    753     coerced, join=join, copy=False, indexes=indexes, fill_value=fill_value
    754 )
--> 755 collected = collect_variables_and_indexes(aligned, indexes=indexes)
    756 prioritized = _get_priority_vars_and_indexes(aligned, priority_arg, compat=compat)
    757 variables, out_indexes = merge_collected(
    758     collected, prioritized, compat=compat, combine_attrs=combine_attrs
    759 )

File ~/miniforge3/envs/instrument-cookbooks-dev/lib/python3.9/site-packages/xarray/core/merge.py:365, in collect_variables_and_indexes(list_of_mappings, indexes)
    362     indexes_.pop(name, None)
    363     append_all(coords_, indexes_)
--> 365 variable = as_variable(variable, name=name)
    366 if name in indexes:
    367     append(name, variable, indexes[name])

File ~/miniforge3/envs/instrument-cookbooks-dev/lib/python3.9/site-packages/xarray/core/variable.py:148, in as_variable(obj, name)
    146     data = as_compatible_data(obj)
    147     if data.ndim != 1:
--> 148         raise MissingDimensionsError(
    149             f"cannot set variable {name!r} with {data.ndim!r}-dimensional data "
    150             "without explicit dimension names. Pass a tuple of "
    151             "(dims, data) instead."
    152         )
    153     obj = Variable(name, data, fastpath=True)
    154 else:

MissingDimensionsError: cannot set variable 'radial_velocity' with 2-dimensional data without explicit dimension names. Pass a tuple of (dims, data) instead.
utils.hpl_to_netcdf(files[0], 'sample_file.nc')
sample_file.nc/2022/202212/20221208/RHI_240_20221208_150544_l0.nc is created succesfully
import xarray as xr
ds = xr.open_dataset('sample_file.nc/2022/202212/20221208/RHI_240_20221208_150544_l0.nc')
ds = ds.set_coords('decimal_time')
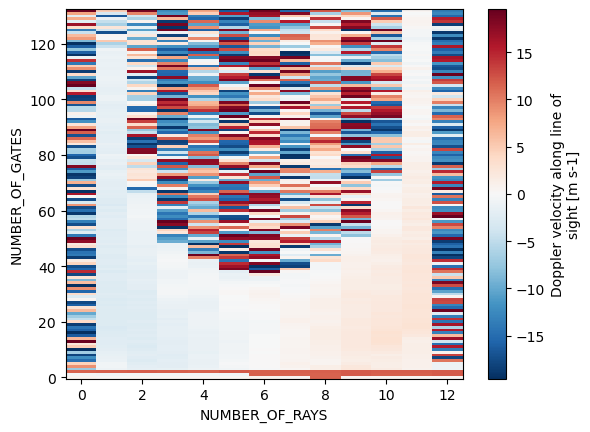
ds.radial_velocity.plot()
<matplotlib.collections.QuadMesh at 0x16cc4e490>
ds.decimal_time.values
array([15.09658333, 15.09703889, 15.09749167, 15.09794722, 15.09840278,
       15.09885556, 15.09931111, 15.09976389, 15.10021667, 15.10067222,
       15.10112778, 15.10158056, 15.10203611])

