National Data Buoy Center (NDBC) Data#
This notebook introduces National Data Buoy Center (NDBC) data with a focus on buoys in Southern Lake Michigan.
The NDBC provides both station metadata and station measurements. NDBC data, guides and documentation can be found on the NDBC web site.
The Standard Meteorological data includes:
WDIR Wind direction
WSPD Wind speed (m/s) averaged over an eight-minute period for buoys and a two-minute period for land stations.
GWS Peak 5 or 8 second wind gusts speed (m/s).
WVHT Significant wave height (m)
DPD Dominant wave period (s)
APD Average wave period (s)
PRES Sea level pressure (hPa)
ATMP Air temperature (Celsius)
WTMP Water temperature (Celsius)
DEWP Dewpoint
Solar Radiation data may include:
SRAD1 Shortwave Radiation, LI-COR LI-200 pyronometer sensor, \(0.4\)-\(1.1~\mu{\rm m}\) ``solar’’ (\({\rm W}/{\rm m}^2\))
SWRAD Shortwave Radiation, Eppley Precision Spectral Pyranometer (PSP), \(0.285\)-\(2.8~\mu{\rm m}\) ``solar’’ (\({\rm W}/{\rm m}^2\))
LWRAD Longwave Radiation, Eppley Precision Infrared Radiometer (PIR), IR from the Earth and atmosphere, \(4\)-\(50~\mu{\rm m}\) (\({\rm W}/{\rm m}^2\))
See the Measurement Description and Units link for more information.
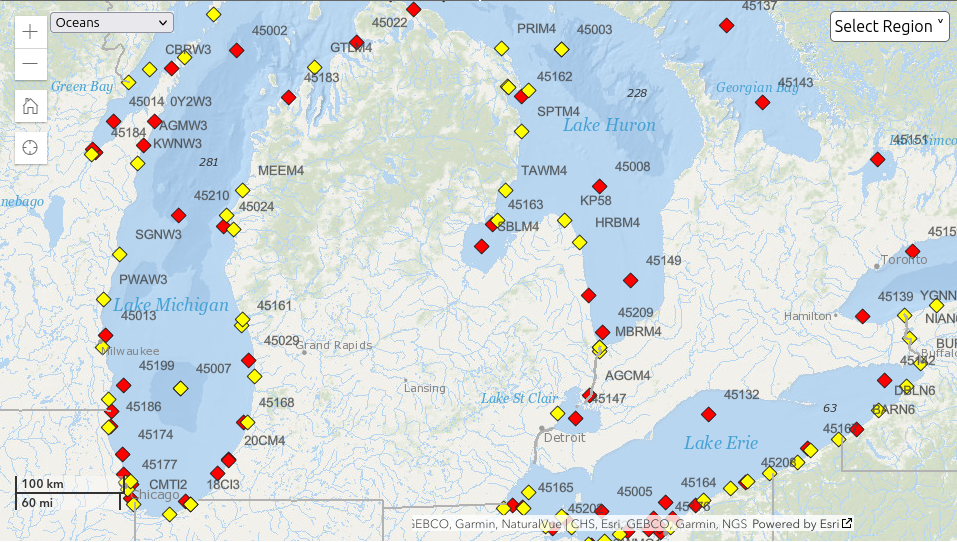
The NDBC web interface (https://www.ndbc.noaa.gov/) which is linked in the image below, is a convenient way to identify stations.
Southern Lake Michigan Buoys#
This list of Southern Lake Michigan Buoys was fine-tuned using the NDBC web interface above , five of these stations appear to be deactivated. The five digit station identifiers below are needed for API calls to return station data.
Identifier |
Name/Location |
Type |
Owner |
Measurements |
|---|---|---|---|---|
KNSW3 |
Kenosha Light, Kenosha, WI |
fixed |
NWS |
WDIR, WSPD, GST, PRES, ATMP |
45187 |
Winthrop Harbor |
buoy |
UIUC |
WDIR, WSPD, GST, WVHT, MWD, ATMP, WTMP |
45186 |
Waukegan Buoy |
buoy |
UIUC |
WDIR, WSPD, GST, WVHT, DPD, ATMP, WTMP |
WHRI2 |
Waukegan Harbor, IL |
fixed |
NWS |
WDIR, WSPD, GST, ATMP |
45174 |
Wilmette Buoy |
buoy |
IL-IN Sea Grant |
WDIR, WSPD, GST, WVHT, DPD, MWD, PRES, ATMP, WTMP, DEWP: ~~SRAD1~~ |
~~FSTI2~~ |
~~Foster Ave, Chicago, IL~~ |
fixed |
~~CPD~~ |
ATMP data ends in 2021 |
OKSI2 |
Oak St., Chicago, IL |
fixed |
CPD |
WDIR, WSPD, GST, ATMP: SRAD1 |
CHII2 |
Harrison-Dever Crib, Chicago, IL |
fixed |
GLERL |
WDIR, WSPD, GST, ATMP, DEWP |
~~45177~~ |
~~Ohio St. Beach, Chicago, IL~~ |
buoy |
~~CPD~~ |
WVHT, DPD, WTMP, last data 2019 |
45198 |
Chicago Buoy |
buoy |
IN-IL Sea Grant |
WDIR, WSPD, GST, WVHT, DPD, WMD, WTMP |
CNII2 |
Northerly Isle, IL |
fixed |
NWS |
WDIR, WSPD, GST, ATMP, DEWP |
~~JAKI2~~ |
~~63rd St. Chicago, IL~~ |
fixed |
~~CPD~~ |
data ends in 2022 |
CMTI2 |
Caulument Harbor, IL |
fixed |
NOAA |
WDIR, WSPD, GST, PRES, ATMP, DEWP |
BHRI3 |
Burns Harbor, IN |
fixed |
NWS |
WDIR, WSPD, GST, PRES, ATMP |
45170 |
Michigan City Buoy, IN |
buoy |
IL-IN Sea Grant |
WDIR, WSPD, GST, WVHT, DPD, WMD, PRES, ATMP, DEWP: SRAD1 |
MCYI3 |
Michigan City Harbor Entrance |
fixed |
GLERL |
WDIR, WSPD, GST, PRES, ATMP, DEWP |
~~18CI3~~ |
~~Michigan City CG Station~~ |
fixed |
~~USCG~~ |
last data 2015 |
45026 |
Cook Nuclear Plant Buoy, Stevensville, MI |
buoy |
Limno Tech |
WDIR, WSPD, GST, WVHT, DPD, WMD, PRES, ATMP, WTMP, DEWP: ~~SRAD1~~ |
~~20CM4~~ |
~~ST. Joseph CG Station, MI~~ |
fixed |
~~USCG~~ |
last data 2015 |
SJOM4 |
St. Joseph, MI |
fixed |
NWS |
WDIR, WSPD, GST, PRES, ATMP |
45168 |
South Haven Buoy, MI |
buoy |
Limno Tech |
WDIR, WSPD, GST, WVHT, DPD, WMD, WTMP,DEWP |
SVNM4 |
South Haven Light, MI |
fixed |
GLERL |
WDIR, WSPD, GST, ATMP |
Station’s with IDs in boldface collect data all year. This most of the fixed station.
Exploring the NDBC with Python#
# Import standard python libraries
import numpy as np            # Numerical Python: scientific
import pandas as pd           # tabular data and timeseries package
import matplotlib.pyplot as plt
import datetime as dt
Active stations#
Import a list of active stations directly from the NDBC as a Data Frame. NB, the five digit station identifiers in this list are lower case. The NBDC search engine is not case sensitive, but various NDBC filenames use both lower and uppercase station IDs.
active_st = pd.read_xml(path_or_buffer="https://www.ndbc.noaa.gov/activestations.xml")
print(active_st.shape)
(1348, 13)
Southern Lake Michigan Buoys#
Create a subset of South Lake Michigan buoys based on a geographical bounding box.
mask = ((active_st['lat'] > 41.5) & (active_st['lat'] < 42.6)  & (active_st['lon'] < -84.7) & (active_st['lon'] > -88))
slm_buoys = active_st.loc[mask]
print(slm_buoys.shape)
#display(slm_buoys)
(22, 13)
The code below removes columns which are not relevant for Lake Michigan. By inspection, some of the stations on the “active” list have not collected data in recent years, the code block below also removes those stattions.
slm_buoys = slm_buoys.drop(['seq','dart','waterquality','currents','pgm'],axis=1)

slm_buoys = (slm_buoys[(slm_buoys.id != "FSTI2") & (slm_buoys.id != "fsti2")]) #  Data collection ended in 2021
slm_buoys = slm_buoys[slm_buoys.id != "45177" ]                                #  Data collection ended in 2019
slm_buoys = slm_buoys[(slm_buoys.id != "JAKI2") & (slm_buoys.id != "jaki2") ]  #  Data collection ended in 2022
slm_buoys = slm_buoys[(slm_buoys.id != "18CI3") & (slm_buoys.id != "18ci3") ]  #  Data collection ended in 2015
slm_buoys = slm_buoys[(slm_buoys.id != "20CM4") & (slm_buoys.id != "20cm4")]   #  Data collection ended in 2015
slm_buoys.reset_index(inplace = True)
print(slm_buoys.shape)
slm_buoys.reset_index(drop=True,inplace=True)
display(slm_buoys)

slm_buoys.to_csv('slm_buoys.txt', header=None, index=None, sep=' ', mode='a')
station_list = slm_buoys['id'].tolist()
print(station_list)
(17, 9)
| index | id | lat | lon | elev | name | owner | type | met | |
|---|---|---|---|---|---|---|---|---|---|
| 0 | 260 | 45026 | 41.982 | -86.619 | 176.0 | Cook Nuclear Plant Buoy, Stevensville, MI | Limno Tech | buoy | n |
| 1 | 290 | 45168 | 42.397 | -86.331 | 177.0 | South Haven Buoy, MI | Limno Tech | buoy | n |
| 2 | 291 | 45170 | 41.755 | -86.968 | 177.0 | Michigan City Buoy, IN | Illinois-Indiana Sea Grant and Purdue Civil En... | buoy | n |
| 3 | 295 | 45174 | 42.135 | -87.655 | 176.0 | Wilmette Buoy, IL | Illinois-Indiana Sea Grant | buoy | n |
| 4 | 304 | 45186 | 42.368 | -87.795 | 176.0 | Waukegan Buoy, IL | University of Illinois at Urbana-Champaign | buoy | n |
| 5 | 305 | 45187 | 42.491 | -87.779 | 176.0 | Winthrop Harbor Buoy, IL | University of Illinois at Urbana-Champaign | buoy | n |
| 6 | 310 | 45198 | 41.892 | -87.563 | 176.0 | Chicago Buoy | Illinois-Indiana Sea Grant and Purdue Civil En... | buoy | n |
| 7 | 658 | bhri3 | 41.646 | -87.147 | 180.0 | Burns Harbor, IN | NWS Central Region | fixed | y |
| 8 | 708 | chii2 | 41.916 | -87.572 | 176.0 | Harrison-Dever Crib, Chicago, IL | GLERL | fixed | y |
| 9 | 723 | cmti2 | 41.730 | -87.538 | 178.5 | 9087044 - Calumet Harbor, IL | NOS | fixed | y |
| 10 | 726 | cnii2 | 41.856 | -87.609 | 180.0 | Northerly Isle, IL | NWS Central Region | fixed | y |
| 11 | 918 | knsw3 | 42.589 | -87.809 | 176.0 | Kenosha Light, Kenosha, WI | NWS Central Region | fixed | n |
| 12 | 989 | mcyi3 | 41.729 | -86.912 | 176.0 | Michigan City Harbor Entrance Light, Michigan ... | GLERL | fixed | y |
| 13 | 1076 | oksi2 | 41.912 | -87.624 | 179.0 | Oak St., Chicago, IL | Chicago Park District | fixed | y |
| 14 | 1220 | sjom4 | 42.098 | -86.494 | 182.0 | St. Joseph, MI | NWS Central Region | fixed | n |
| 15 | 1248 | svnm4 | 42.401 | -86.288 | 176.0 | South Haven Light, South Haven, MI | GLERL | fixed | n |
| 16 | 1324 | whri2 | 42.361 | -87.813 | 180.0 | Waukegan Harbor, IL | NWS Central Region | fixed | y |
['45026', '45168', '45170', '45174', '45186', '45187', '45198', 'bhri3', 'chii2', 'cmti2', 'cnii2', 'knsw3', 'mcyi3', 'oksi2', 'sjom4', 'svnm4', 'whri2']
met: indicates whether the station has reported meteorological data in the past eight hours (y/n). Mosy buoy’s are recovered for winter and won’t report meteorological data in winter montsh.
Realtime Meteorological Data#
NDBC has separate file and directory structures for historic and realtime data (from the last 45 days). In particular, filenames for historic data use lower case station IDs while reatime data use upper case station IDs.
# Create a function to fetch and wrangle realtime data. Stdmet data is saved under the .txt extension.

def get_rt_data(stationid):

    url = 'https://www.ndbc.noaa.gov/data/realtime2/' + stationid.upper() + '.txt'
    df = pd.read_table(url,sep = "\s+")

    # Wrangle the Buoy Data
    units = df.loc[0]
    df.drop(df.index[0], inplace=True)

    # Set the column types
    df['#YY'] = df['#YY'].astype(int)
    df['MM'] = df['MM'].astype(int)
    df['DD'] = df['DD'].astype(int)
    df['hh'] = df['hh'].astype(int)
    df['mm'] = df['mm'].astype(int)
    if 'WDIR' in df.columns:
        df['WDIR'] = pd.to_numeric(df['WDIR'], errors='coerce')
    if 'WSPD' in df.columns:
        df['WSPD'] = pd.to_numeric(df['WSPD'], errors='coerce')
    if 'GST' in df.columns:
        df['GST'] = pd.to_numeric(df['GST'], errors='coerce')
    if 'WVHT' in df.columns:
        df['WVHT'] = pd.to_numeric(df['WVHT'], errors='coerce')
    if 'DPD' in df.columns:
        df['DPD'] = pd.to_numeric(df['DPD'], errors='coerce')
    if 'APD' in df.columns:
        df['APD'] = pd.to_numeric(df['APD'], errors='coerce')
    if 'MWD' in df.columns:
        df['MWD'] = pd.to_numeric(df['MWD'], errors='coerce')
    if 'PRES' in df.columns:
        df['PRES'] = pd.to_numeric(df['PRES'], errors='coerce')
    if 'ATMP' in df.columns:
        df['ATMP'] = pd.to_numeric(df['ATMP'], errors='coerce')
    if 'WTMP' in df.columns:
        df['WTMP'] = pd.to_numeric(df['WTMP'], errors='coerce')
    if 'DEWP' in df.columns:
        df['DEWP'] = pd.to_numeric(df['DEWP'], errors='coerce')
    if 'VIS' in df.columns:
        df['VIS'] = pd.to_numeric(df['VIS'], errors='coerce')
    if 'TIDE' in df.columns:
        df['TIDE'] = pd.to_numeric(df['TIDE'], errors='coerce')
    if 'PTDY' in df.columns:
        df['PTDY'] = pd.to_numeric(df['PTDY'], errors='coerce')

    df['datetime'] = pd.to_datetime(dict(year=df['#YY'], month=df.MM,  day = df.DD, hour=df.hh, minute=df.mm))
    df.set_index('datetime',inplace=True)
    return (df)
Realtime data for the Harrison-Dever Crib (CHII2)#
StationID = 'CHII2'
rtdf = get_rt_data(StationID)
StationName = slm_buoys.loc[slm_buoys['id'] == StationID.lower(),'name'].iloc[0]
print(StationName)
print(rtdf.head())
Harrison-Dever Crib, Chicago, IL
                      #YY  MM  DD  hh  mm  WDIR  WSPD   GST  WVHT  DPD  APD  \
datetime
2025-01-30 21:20:00  2025   1  30  21  20   210   9.3   9.8   NaN  NaN  NaN
2025-01-30 21:10:00  2025   1  30  21  10   210   9.3  10.8   NaN  NaN  NaN
2025-01-30 21:00:00  2025   1  30  21   0   210   9.8  11.3   NaN  NaN  NaN
2025-01-30 20:50:00  2025   1  30  20  50   210   9.3  10.3   NaN  NaN  NaN
2025-01-30 20:40:00  2025   1  30  20  40   220  12.4  14.4   NaN  NaN  NaN

                     MWD  PRES  ATMP  WTMP  DEWP  VIS  PTDY  TIDE
datetime
2025-01-30 21:20:00  NaN   NaN   9.3   NaN   4.7  NaN   NaN   NaN
2025-01-30 21:10:00  NaN   NaN   9.0   NaN   4.7  NaN   NaN   NaN
2025-01-30 21:00:00  NaN   NaN   8.9   NaN   4.6  NaN   NaN   NaN
2025-01-30 20:50:00  NaN   NaN   9.2   NaN   4.3  NaN   NaN   NaN
2025-01-30 20:40:00  NaN   NaN   9.4   NaN   4.6  NaN   NaN   NaN
import matplotlib.pyplot as plt
import matplotlib.colors as mcolors

pad = 1.05
my_ytick_labels=['N','E','S','W','N']

fig, (ax1, ax2, ax3) = plt.subplots(3, 1, figsize=(14, 12))
#fig.suptitle(StationName,y=0.99)
fig.suptitle(StationName + " (" + StationID + ")",y=0.95)

ax1b = ax1.twinx()
ax2b = ax2.twinx()
ax3b = ax3.twinx()

ax1.grid(True)
ax1.axis([rtdf.first_valid_index(),rtdf.last_valid_index(),0,360])
major_angle_ticks = np.arange(0,361,90)
ax1.set_yticks(major_angle_ticks)
ax1b.set_yticks(major_angle_ticks)
ax1.plot(rtdf.index, rtdf['WDIR'],
         color='indigo',
         linestyle='none',
         marker='o',
         markersize=1,
         linewidth=1)
ax1.set_ylabel('Wind Direction')
ax1b.set_yticks(ticks=major_angle_ticks,labels=my_ytick_labels)
#ax1.set_xlabel('Time (UTC)')
ax1.set_title('Wind Direction Timeseries')

# Wind speed, gust, direction
ax2.axis([rtdf.first_valid_index(),rtdf.last_valid_index(),0,rtdf['GST'].max()])
ax2b.axis([rtdf.first_valid_index(),rtdf.last_valid_index(),0,1.9438*rtdf['GST'].max()])
ax2.plot(rtdf.index, rtdf['GST'],
         color='saddlebrown',
         linewidth=0.5,
         linestyle='--',
         label='GST')
ax2.plot(rtdf.index, rtdf['WSPD'],
         color='darkorange',
          linewidth=0.5,
          label='WSPD')
ax2.set_ylabel('Wind Speed [m/s]')
ax2b.set_ylabel('Wind Speed [kn]')
ax2.legend(loc='upper right')

# Temperature

ax3.axis([rtdf.first_valid_index(),rtdf.last_valid_index(),rtdf['DEWP'].min(),rtdf['ATMP'].max()+5/9])
ax3b.axis([rtdf.first_valid_index(),rtdf.last_valid_index(),rtdf['DEWP'].min()*9/5+32,9*rtdf['ATMP'].max()/5 +32+1])
ax3.plot(rtdf.index, rtdf['DEWP'],
         linewidth=0.5,
         color='black',
         label='DEWP')
ax3.plot(rtdf.index, rtdf['ATMP'],
         linewidth=0.2,
         color='cornflowerblue',
         label='ATMP')
ax3.set_ylabel('Temperature [degC]')
ax3b.set_ylabel('Temperature [degF]')
ax3.legend(loc='upper right')

plt.savefig('realtime.pdf')
plt.show()

Distribution of Wind Speeds
import matplotlib.pyplot as plt
bins = np.linspace(start=0,stop=rtdf["GST"].max(),num=25)  # return evenly spaced numbers over an interval
plt.hist(rtdf["GST"],bins, alpha=0.5, label="Gusts",color='orange',edgecolor='darkorange',align='right')
plt.hist(rtdf["WSPD"],bins, alpha=0.5, label="Wind Speed",color='blue',edgecolor='darkblue',align='right')
plt.legend(loc='upper right')
plt.xlabel('Speed (m/s)')
plt.ylabel('Frequency')
plt.title('Frequency of Wind Speeds (' + StationID + ')')
plt.show()

Get data from nearby stations for comparison
StationID2 = 'OKSI2'
StationID3 = 'CNII2'

StationName2 = slm_buoys.loc[slm_buoys['id'] == StationID2.lower(),'name'].iloc[0]
StationName3 = slm_buoys.loc[slm_buoys['id'] == StationID3.lower(),'name'].iloc[0]

station2_df = get_rt_data('OKSI2')
station3_df = get_rt_data('CNII2')
The windroses below show a prominent windshadow for the Oak St. station.
from windrose import WindroseAxes

fig, (ax1, ax2, ax3) = plt.subplots(1, ncols=3, figsize=(15, 5), subplot_kw ={'projection': 'windrose'})
fig.suptitle("Windroses from Three Nearby Stations",y=1.1)

fig.add_axes(ax1)
ax1.bar(rtdf["WDIR"], rtdf['WSPD'], normed=True, opening=0.8, edgecolor="white")
ax1.set_legend(units="m/s")
ax1.set_title(StationName + " (" + StationID + ")",y=1.1)

fig.add_axes(ax2)
ax2.bar(station2_df["WDIR"], station2_df['WSPD'], normed=True, opening=0.8, edgecolor="white")
ax2.set_legend(units="m/s")
ax2.set_title(StationName2 + " (" + StationID2 + ")",y=1.1)

#ax3 = WindroseAxes.from_ax()
ax3.bar(station3_df["WDIR"], station3_df['WSPD'], normed=True, opening=0.8, edgecolor="white")
ax3.set_legend(units="m/s")
ax3.set_title(StationName3 + " (" + StationID3 +")",y=1.1)

plt.tight_layout()
plt.show()

Historial NDBC Data#
The top level directory or historical ndbc data is https://www.ndbc.noaa.gov/data/historical/. Standard meteoroligical data (smet) if found in the directory https://www.ndbc.noaa.gov/data/historical/stdmet/, while standard radiation data is found in https://www.ndbc.noaa.gov/data/historical/srad/
Unlike reatime data, the filenames for historic data contain station IDs in lower case. The data is stored in separate files for each year.
https://www.ndbc.noaa.gov/view_text_file.php?filename=chii2h2023.txt.gz&dir=data/historical/stdmet/ https://www.ndbc.noaa.gov/data/historical/stdmet/chii2h2023.txt.gz
def get_hdata(station,year):

    url = 'https://www.ndbc.noaa.gov/data/historical/stdmet/' + station.lower() + 'h' + str(year) + '.txt.gz'
    df = pd.read_table(url,sep = "\s+",compression='gzip',low_memory=False)
    # Wrangle the Buoy Data
    units = df.loc[0]
    df.drop(df.index[0], inplace=True)
    # Set the column types
    df['#YY'] = df['#YY'].astype(int)
    df['MM'] = df['MM'].astype(int)
    df['DD'] = df['DD'].astype(int)
    df['hh'] = df['hh'].astype(int)
    df['mm'] = df['mm'].astype(int)
    if 'WDIR' in df.columns:
        df['WDIR'] = pd.to_numeric(df['WDIR'], errors='coerce')
    if 'WSPD' in df.columns:
        df['WSPD'] = pd.to_numeric(df['WSPD'], errors='coerce')
    if 'GST' in df.columns:
        df['GST'] = pd.to_numeric(df['GST'], errors='coerce')
    if 'WVHT' in df.columns:
        df['WVHT'] = pd.to_numeric(df['WVHT'], errors='coerce')
    if 'DPD' in df.columns:
        df['DPD'] = pd.to_numeric(df['DPD'], errors='coerce')
    if 'APD' in df.columns:
        df['APD'] = pd.to_numeric(df['APD'], errors='coerce')
    if 'MWD' in df.columns:
        df['MWD'] = pd.to_numeric(df['MWD'], errors='coerce')
    if 'PRES' in df.columns:
        df['PRES'] = pd.to_numeric(df['PRES'], errors='coerce')
    if 'ATMP' in df.columns:
        df['ATMP'] = pd.to_numeric(df['ATMP'], errors='coerce')
    if 'WTMP' in df.columns:
        df['WTMP'] = pd.to_numeric(df['WTMP'], errors='coerce')
    if 'DEWP' in df.columns:
        df['DEWP'] = pd.to_numeric(df['DEWP'], errors='coerce')
    if 'VIS' in df.columns:
        df['VIS'] = pd.to_numeric(df['VIS'], errors='coerce')
    if 'TIDE' in df.columns:
        df['TIDE'] = pd.to_numeric(df['TIDE'], errors='coerce')
    if 'PTDY' in df.columns:
        df['PTDY'] = pd.to_numeric(df['PTDY'], errors='coerce')

    df['datetime'] = pd.to_datetime(dict(year=df['#YY'], month=df.MM,  day = df.DD, hour=df.hh, minute=df.mm))
    df.set_index('datetime',inplace=True)

# NDBC uses these numeric values to indicate no data was taken

    df['WVHT'] = df['WVHT'].replace({99.00: np.nan})
    df['DPD'] = df['DPD'].replace({99.00: np.nan})
    df['APD'] = df['APD'].replace({99.00: np.nan})
    df['MWD'] = df['MWD'].replace({999: np.nan})
    df['PRES'] = df['PRES'].replace({9999.0: np.nan})
    df['WTMP'] = df['WTMP'].replace({999.0: np.nan})
    df['VIS'] = df['VIS'].replace({99.0: np.nan})
    df['TIDE'] = df['TIDE'].replace({99.0: np.nan})

    return (df)
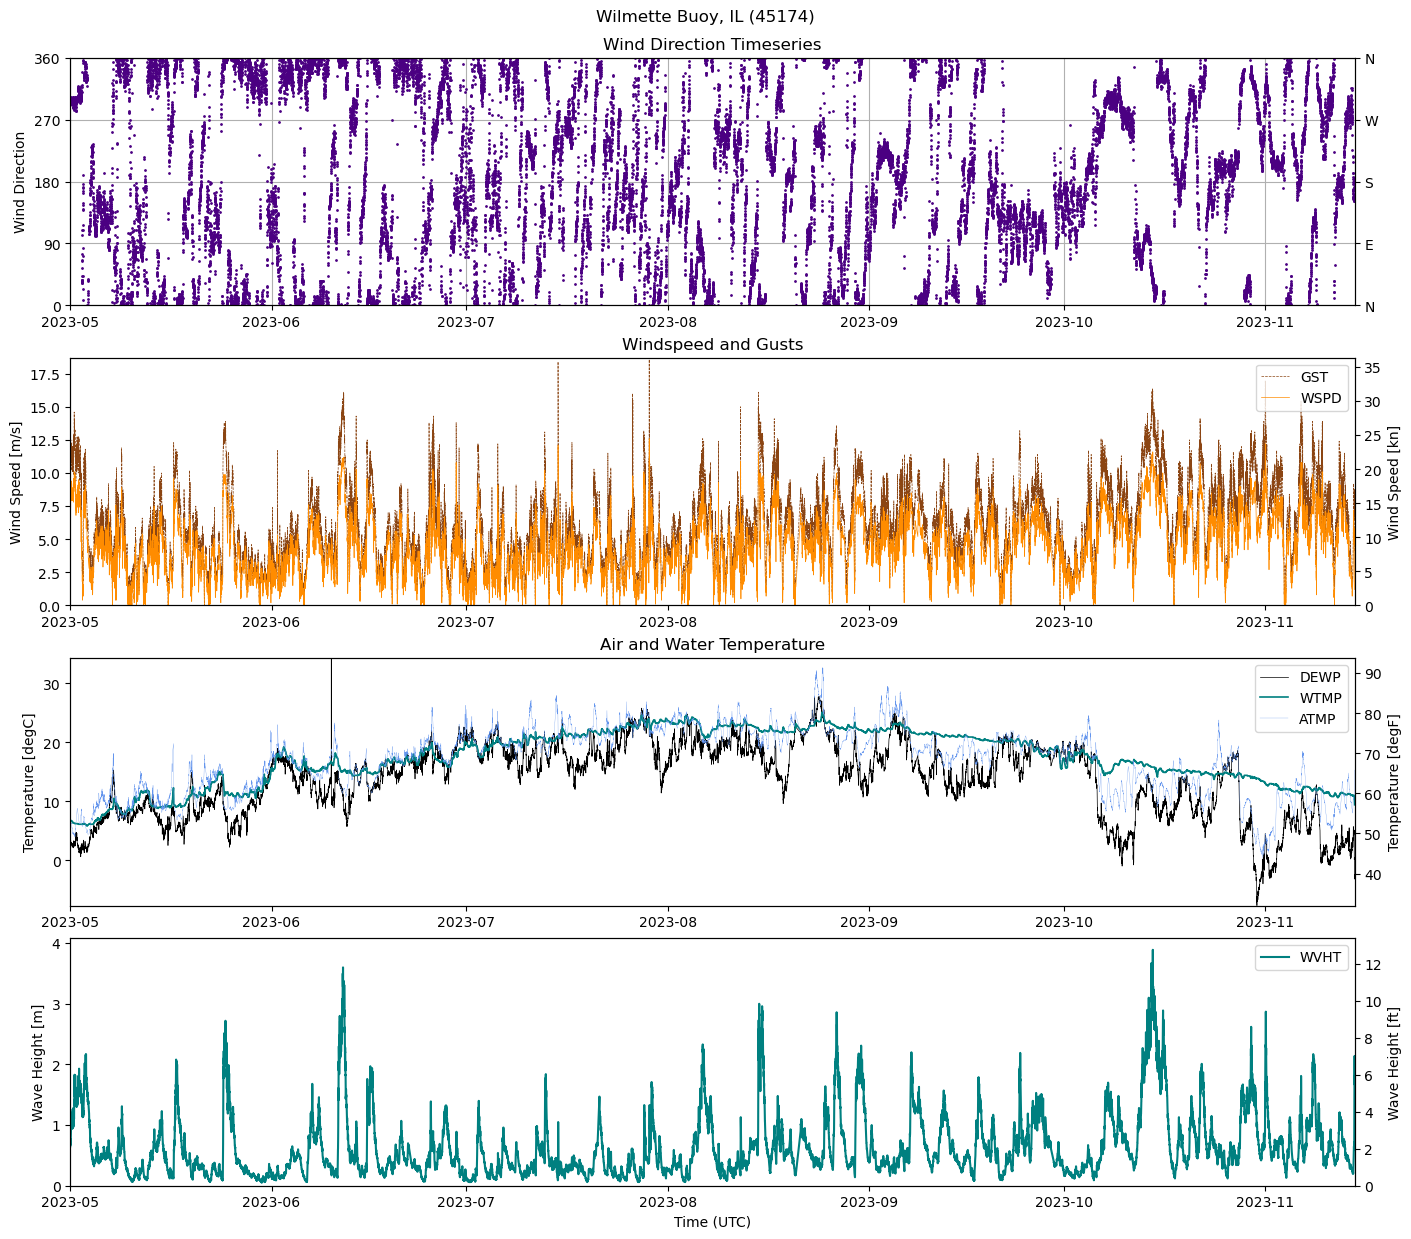
df = get_hdata('45174',2023) # Wilmette Buoy
StationName = slm_buoys.loc[slm_buoys['id'] == '45174','name'].iloc[0]
print(StationName)
print(df.head())
Wilmette Buoy, IL
                      #YY  MM  DD  hh  mm  WDIR  WSPD   GST  WVHT   DPD  APD  \
datetime
2023-05-01 00:00:00  2023   5   1   0   0   291   8.4  11.3  0.65  3.04  NaN
2023-05-01 00:10:00  2023   5   1   0  10   293   8.4  11.1  0.70  3.06  NaN
2023-05-01 00:20:00  2023   5   1   0  20   295   8.1  11.2  0.75  3.12  NaN
2023-05-01 00:30:00  2023   5   1   0  30   299   7.6   9.3  0.77  3.12  NaN
2023-05-01 00:40:00  2023   5   1   0  40   294   7.4  10.6  0.76  3.14  NaN

                       MWD   PRES  ATMP  WTMP  DEWP  VIS  TIDE
datetime
2023-05-01 00:00:00  326.0  995.6   6.1   6.8   2.9  NaN   NaN
2023-05-01 00:10:00  328.0  995.7   6.1   6.8   4.0  NaN   NaN
2023-05-01 00:20:00  322.0  995.7   6.1   6.8   3.2  NaN   NaN
2023-05-01 00:30:00  179.0  995.7   6.0   6.8   3.4  NaN   NaN
2023-05-01 00:40:00  335.0  995.7   5.9   6.8   3.4  NaN   NaN
import matplotlib.pyplot as plt
import matplotlib.colors as mcolors

pad = 1.05
my_ytick_labels=['N','E','S','W','N']

fig, (ax1, ax2, ax3, ax4) = plt.subplots(4, 1, figsize=(14, 12), constrained_layout=True)
fig.suptitle(StationName + " (45174)",y=1.02)

ax1b = ax1.twinx()
ax2b = ax2.twinx()
ax3b = ax3.twinx()
ax4b = ax4.twinx()

ax1.grid(True)
ax1.axis([df.first_valid_index(),df.last_valid_index(),0,360])
major_angle_ticks = np.arange(0,361,90)
ax1.set_yticks(major_angle_ticks)
ax1b.set_yticks(major_angle_ticks)
ax1.plot(df.index, df['WDIR'],
         color='indigo',
         linestyle='none',
         marker='o',
         markersize=1,
         linewidth=1)
ax1.set_ylabel('Wind Direction')
ax1b.set_yticks(ticks=major_angle_ticks,labels=my_ytick_labels)
#ax1.set_xlabel('Time (UTC)')
ax1.set_title('Wind Direction Timeseries')

# Wind speed, gust, direction
ax2.axis([df.first_valid_index(),df.last_valid_index(),0,df['GST'].max()])
ax2b.axis([df.first_valid_index(),df.last_valid_index(),0,1.9438*df['GST'].max()])

ax2.plot(df.index, df['GST'],
         color='saddlebrown',
         linewidth=0.5,
         linestyle='--',
         label='GST')
ax2.plot(df.index, df['WSPD'],
         color='darkorange',
          linewidth=0.5,
          label='WSPD')

ax2.set_title('Windspeed and Gusts')
ax2.set_ylabel('Wind Speed [m/s]')
ax2b.set_ylabel('Wind Speed [kn]')
ax2.legend(loc='upper right')


# Water temperature

ax3.axis([df.first_valid_index(),df.last_valid_index(),df['DEWP'].min(),pad*df['ATMP'].max()])
ax3b.axis([df.first_valid_index(),df.last_valid_index(),32,pad*9*df['ATMP'].max()/5 +32])
ax3.plot(df.index, df['DEWP'],
         linewidth=0.5,
         color='black',
         label='DEWP')
ax3.plot(df.index, df['WTMP'],
         linewidth=1.2,
         color='teal',
         label='WTMP')
ax3.plot(df.index, df['ATMP'],
         linewidth=0.2,
         color='cornflowerblue',
         label='ATMP')
ax3.set_ylabel('Temperature [degC]')
ax3b.set_ylabel('Temperature [degF]')
ax3.legend(loc='upper right')
ax3.set_title('Air and Water Temperature')

ax4.axis( [df.first_valid_index(),df.last_valid_index(),0,pad*df['WVHT'].max()])
ax4b.axis([df.first_valid_index(),df.last_valid_index(),0,pad*3.28*df['WVHT'].max()])
ax4.plot(df.index, df['WVHT'],
         linewidth=1.5,
         color='teal',
         label='WVHT')
ax4.set_ylabel('Wave Height [m]')
ax4b.set_ylabel('Wave Height [ft]')
ax4.legend(loc='upper right')
ax4.set_xlabel('Time (UTC)')

#plt.savefig('images/buoyplots.pdf')
plt.show()
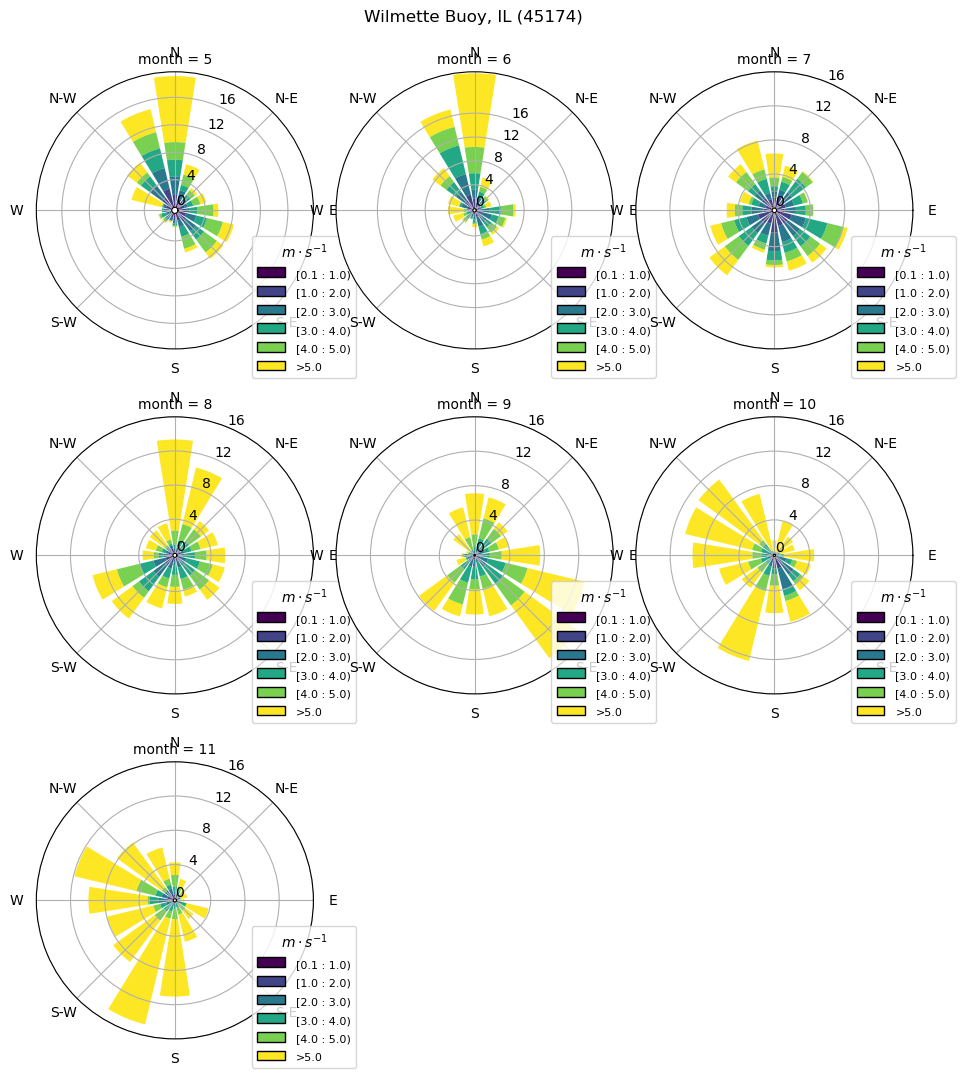
# From the example scripts in https://windrose.readthedocs.io/en/latest/usage.html

from windrose import WindroseAxes, plot_windrose
import seaborn as sns

def plot_windrose_subplots(data, *, direction, var, color=None, **kwargs):
    """wrapper function to create subplots per axis"""
    ax = plt.gca()
    ax = WindroseAxes.from_ax(ax=ax)
    plot_windrose(direction_or_df=data[direction], var=data[var], ax=ax, **kwargs)

df = df.rename(columns={'MM': 'month'})

g = sns.FacetGrid(
    data=df,
    # the column name for each level a subplot should be created
    col="month",
    # place a maximum of 3 plots per row
    col_wrap=3,
    subplot_kws={"projection": "windrose"},
    sharex=False,
    sharey=False,
    despine=False,
    height=3.5,
)

g.map_dataframe(
    plot_windrose_subplots,
    direction="WDIR",
    var="WSPD",
    normed=True,
    # manually set bins, so they match for each subplot
    bins=(0.1, 1, 2, 3, 4, 5),
    calm_limit=0.1,
    kind="bar",
)

# make the subplots easier to compare, by having the same y-axis range
y_ticks = range(0, 17, 4)
for ax in g.axes:
    ax.set_legend(
        title="$m \cdot s^{-1}$", bbox_to_anchor=(1.15, -0.1), loc="lower right"
    )
    ax.set_rgrids(y_ticks, y_ticks)

# adjust the spacing between the subplots to have sufficient space between plots
plt.subplots_adjust(wspace=-0.2)
plt.suptitle(StationName + " (45174)",y=1.02)
Text(0.5, 1.02, 'Wilmette Buoy, IL (45174)')
Historical Radiation Data
def get_hrdata(station,year):

    url = 'https://www.ndbc.noaa.gov/data/historical/srad/' + station.lower() + 'r' + str(year) + '.txt.gz'
    print(url)
    df = pd.read_table(url,sep = "\s+",compression='gzip',low_memory=False)

    # Wrangle the Buoy Data
    units = df.loc[0]
    df.drop(df.index[0], inplace=True)
    # Set the column types
    df['#YY'] = df['#YY'].astype(int)
    df['MM'] = df['MM'].astype(int)
    df['DD'] = df['DD'].astype(int)
    df['hh'] = df['hh'].astype(int)
    df['mm'] = df['mm'].astype(int)
    if 'SRAD1' in df.columns:
        df['SRAD1'] = pd.to_numeric(df['SRAD1'], errors='coerce')
    if 'SWRAD' in df.columns:
        df['SWRAD'] = pd.to_numeric(df['SWRAD'], errors='coerce')
    if 'LWRAD' in df.columns:
        df['LWRAD'] = pd.to_numeric(df['LWRAD'], errors='coerce')

    df['datetime'] = pd.to_datetime(dict(year=df['#YY'], month=df.MM,  day = df.DD, hour=df.hh, minute=df.mm))
    df.set_index('datetime',inplace=True)

# NDBC uses these numerical values to indicate that no data was taken

    df['SRAD1'] = df['SRAD1'].replace({9999.0: np.nan})
    df['SWRAD'] = df['SWRAD'].replace({9999.0: np.nan})
    df['LWRAD'] = df['LWRAD'].replace({9999.0: np.nan})

    return (df)
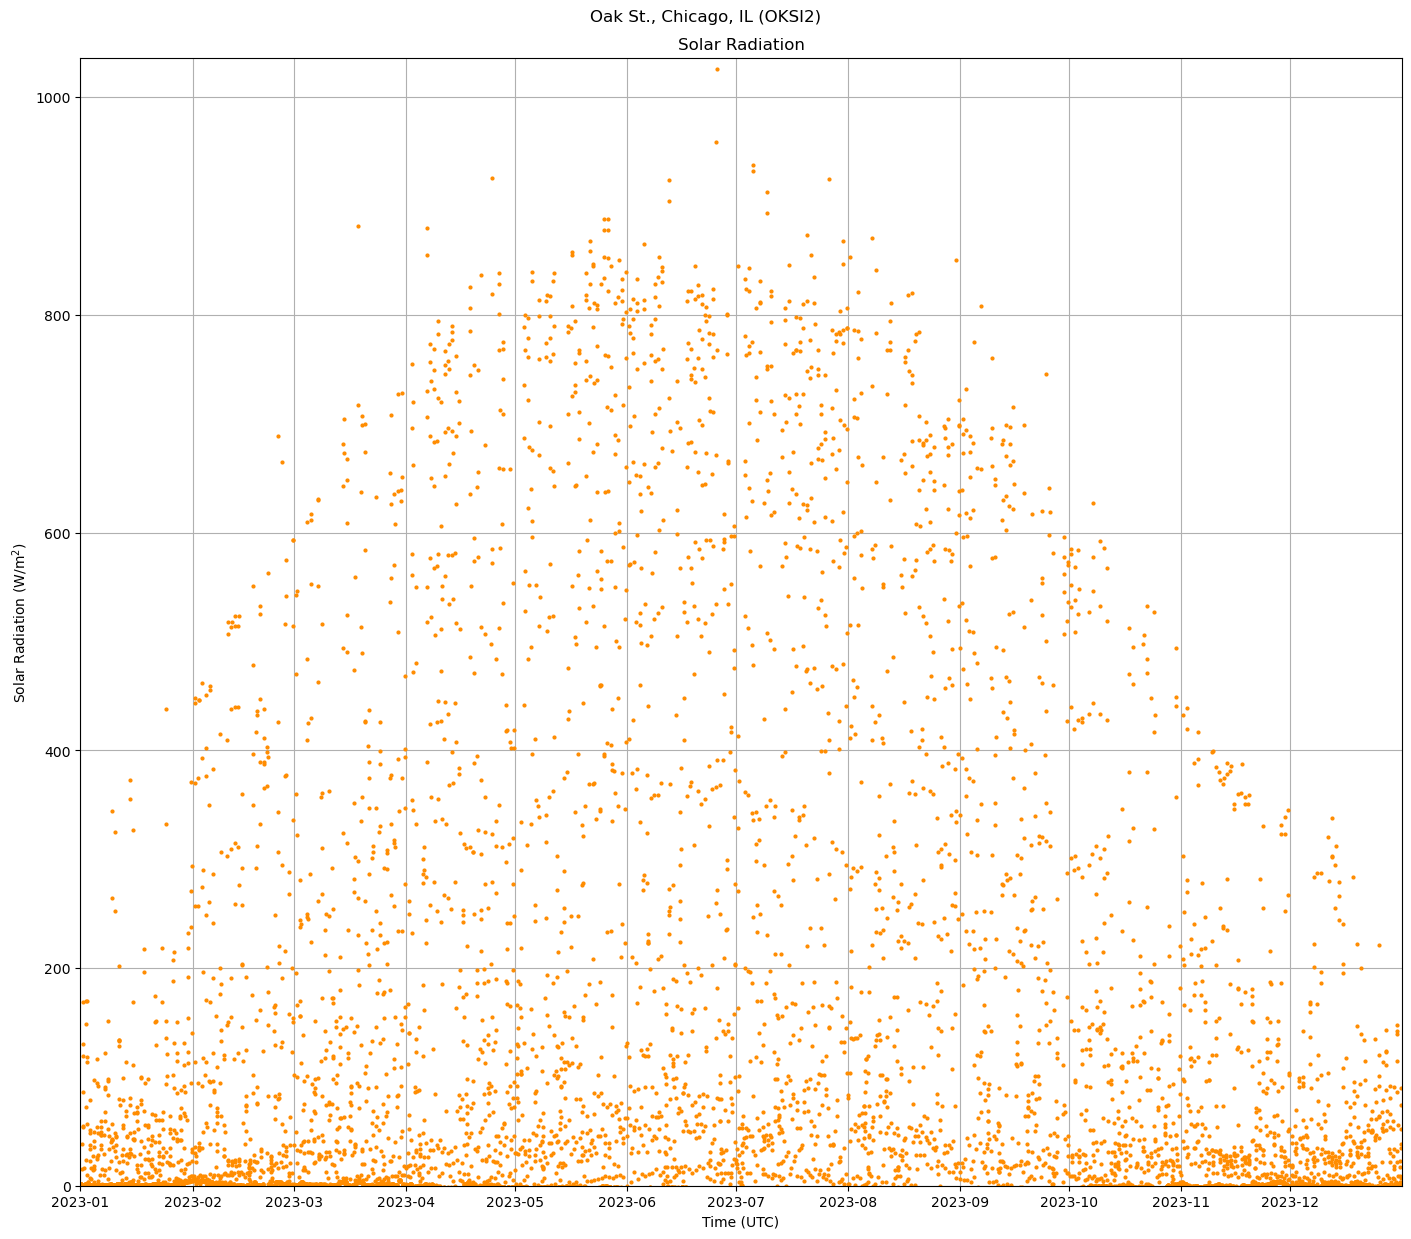
df = get_hrdata('OKSI2',2023)
StationName = slm_buoys.loc[slm_buoys['id'] == 'oksi2','name'].iloc[0]
print(StationName)
print(df.head())
https://www.ndbc.noaa.gov/data/historical/srad/oksi2r2023.txt.gz
Oak St., Chicago, IL
                      #YY  MM  DD  hh  mm  SRAD1  SWRAD  LWRAD
datetime
2023-01-01 00:00:00  2023   1   1   0   0    2.0    NaN    NaN
2023-01-01 01:00:00  2023   1   1   1   0    2.0    NaN    NaN
2023-01-01 02:00:00  2023   1   1   2   0    2.0    NaN    NaN
2023-01-01 03:00:00  2023   1   1   3   0    2.0    NaN    NaN
2023-01-01 04:00:00  2023   1   1   4   0    2.0    NaN    NaN
import matplotlib.pyplot as plt
import matplotlib.colors as mcolors

pad = 1.01

fig, ax1 = plt.subplots(1, 1, figsize=(14, 12), constrained_layout=True)
fig.suptitle(StationName + " (OKSI2)",y=1.02)

ax1.grid(True)
ax1.axis([df.first_valid_index(),df.last_valid_index(),0,pad*df['SRAD1'].max()])
ax1.plot(df.index, df['SRAD1'],
         color=mcolors.CSS4_COLORS['darkorange'],
         linestyle='none',
         marker='o',
         markersize=2,
         linewidth=1)
ax1.set_ylabel('Solar Radiation (W/m${}^2$)')
ax1.set_xlabel('Time (UTC)')
ax1.set_title('Solar Radiation')

plt.show()
Python APIs for the NDBC#
Thare are several python packages that serve as APIs for the NBDC including:
Siphon a collection of Python utilities for downloading data from remote data services. These unidata packages have good search functions. Data retrieval currently seems to be implemented only for realtime data. Unidata is a UCAR community program. See also
ndbc-api, this Github also contains Example Notebook. ndbc-api also has a PyPi Repository. The station search methods in ndbc_api return very incomplete results. In particular, as of February 2024, the stations() method currently returns 146 out of 1323 stations, and nearest_station() method seems restricted to that subset. The ndbc_api methods which access station data and metadata seem to work for the complete set of buoy’s provided you have the five digit station identifier. Those methods are.
station() which returns station metadata
available_realtime() which can return data from the last 45 days
available_historical() which returns older data.
NDBC A pacakge to simplify to retrieval and parsing of NOAA NDBC data.
seebuoy Easily access real time and historical data from the National Data Buoy Center.