Current Weather Quicklooks#
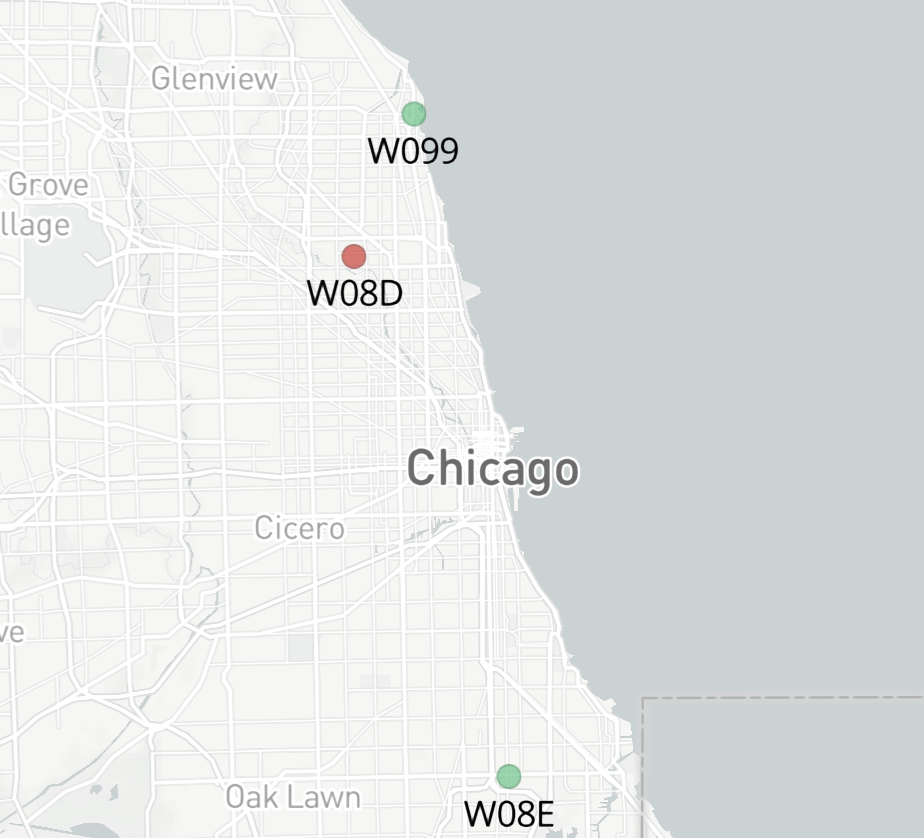
Site Overview#
The sites:
W099 - Northwestern University (NU)
W08D - Northeastern Illinois University (NEIU)
W08E - Chicago State University (CSU)
import sage_data_client
start = "-1h"
Show code cell source
wxt_df = sage_data_client.query(
start=start,
filter={
"sensor": "vaisala-wxt536",
"name": "wxt.wind.*",
"vsn": "W08D|W099"
}
)
Code to Create Plots#
Show code cell source
import sage_data_client
from bokeh.models.formatters import DatetimeTickFormatter
import hvplot.pandas
import hvplot.xarray
import holoviews as hv
import cartopy.crs as ccrs
import cartopy.feature as cfeature
import xarray as xr
import matplotlib.pyplot as plt
from metpy.plots import USCOUNTIES
import metpy.calc as mpcalc
import act
import numpy as np
import pandas as pd
import warnings
from bokeh.models import DatetimeTickFormatter
import panel as pn
start = "-6h"
def apply_formatter(plot, element):
plot.handles['xaxis'].formatter = DatetimeTickFormatter(hours='%m/%d/%Y \n %H:%M',
minutes='%m/%d/%Y \n %H:%M',
hourmin='%m/%d/%Y \n %H:%M',
days='%m/%d/%Y \n %H:%M',
months='%m/%d/%Y \n %H:%M')
xr.set_options(keep_attrs=True)
warnings.filterwarnings("ignore")
hv.extension("bokeh")
# Dictionary for renaming to standard names
variable_rename_dict = {'wxt.env.humidity':'relative_humidity',
'wxt.env.pressure':'air_pressure',
'wxt.env.temp':'air_temperature',
'wxt.heater.temp':'heater_temperature',
'wxt.heater.volt':'heater_voltage',
'wxt.rain.accumulation':'rain_accumulation',
'wxt.wind.direction':'wind_direction',
'wxt.wind.speed':'wind_speed',
'sys.gps.lat':'latitude',
'sys.gps.lon':'longitude',
}
# Dictionary for units that are missing
units_dict = {'wxt.env.temp': 'degC',
'wxt.env.pressure':'hPa',
'wxt.env.humidity':'percent',
'wxt.wind.speed':'m/s',
'wxt.wind.direction':'degrees'}
def generate_data_array(df, variable, rename_variable_dict=variable_rename_dict):
new_variable_name = rename_variable_dict[variable]
df_variable= df.loc[df.name == variable]
ds = df_variable.to_xarray().rename({'value':new_variable_name,
'timestamp':'time',
'meta.vsn':'node'})
ds[new_variable_name].attrs['units'] = df_variable['meta.units'].values[0]
ds['time'] = pd.to_datetime(ds.time)
ds.attrs['datastream'] = ds.node.values[0]
return ds[[new_variable_name]]
def generate_dataset(df, variables, rename_variable_dict=variable_rename_dict):
try:
reindexed = df.set_index(['meta.vsn', 'timestamp'])
except:
reindexed = df.set_index(['timestamp'])
return xr.merge([generate_data_array(reindexed, variable) for variable in variables])
crocus_nodes = "W08D|W099"
# Query and load for n numbder of days
wxt_df = sage_data_client.query(
start=start,
filter={
"sensor": "vaisala-wxt536",
"name": "wxt.env.*",
"vsn": crocus_nodes
}
)
wxt_df1 = sage_data_client.query(
start=start,
filter={
"sensor": "vaisala-wxt536",
"name": "wxt.wind.*",
"vsn": crocus_nodes
}
)
wxt_df = pd.concat([wxt_df, wxt_df1])
try:
wxt_variables = wxt_df.name.unique()
wxt_df['meta.units'] = wxt_df.name.map(units_dict)
wxt_ds = generate_dataset(wxt_df, wxt_variables).squeeze().metpy.parse_cf()
wxt_ds['air_dewpoint_temperature'] = mpcalc.dewpoint_from_relative_humidity(wxt_ds.air_temperature, wxt_ds.relative_humidity)
# Resample to 1 minute freqency
minute_ds = wxt_ds.resample(time='1T').mean()
plots = []
for node in minute_ds.node.values:
minute_ds_subset = minute_ds.sel(node=node)
wxt_ds_subset = wxt_ds.sel(node=node)
temp_plot = minute_ds_subset.air_temperature.hvplot(color='red',
label='Air Temperature (degC)')
dewp_plot = minute_ds_subset.air_dewpoint_temperature.hvplot(color ='green',
label='Dewpoint Temperature (degC)')
plots.append((temp_plot * dewp_plot).opts(hooks=[apply_formatter]))
meteogram_variables = ['wind_speed', 'wind_direction']
for variable in meteogram_variables:
plots.append((wxt_ds_subset[variable].hvplot.line(label='10 Hz Data') *
minute_ds[variable].hvplot.line(label='1 Minute Data')).opts(hooks=[apply_formatter]))
except:
minute_ds = None
plots = pn.Row('No Data Available')
Show code cell source
hv.Layout(plots).cols(1)